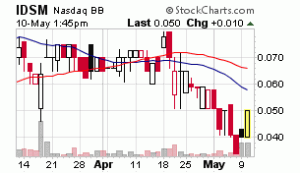
IDSM – Industrial Minerals is bouncing today after seemingly finding support after a strong downward move. The stock has moved up 25% in today’s trading on double the daily average volume going into the last hour before the closing bell. IDSM reached support in the .04 area and has rebounded nicely in what may be an attempt to reach the recent highs of Feb. and March. The 52 week high is .10 with average three month daily trading volume of 475,319 shares. No real news as been released from the company other than normal filing requirements. Today’s action is probably only a bounce play s the result of smart traders waiting for established support to be reached before taking positions after the latest pull back from the highs.
Entries tagged with “Penny Stocks”.
Tue 10 May 2011
IDSM – Industrial Minerals
Posted by smadmin under Penny Stock Charts Of Interest
Comments Off
Tue 10 May 2011
BONZ – Bonanza Goldfields Corp
Posted by smadmin under Penny Stocks Moverz
Comments Off
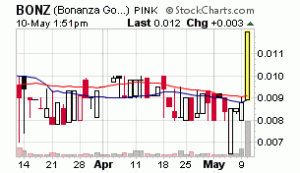
BONZ – Bonanza Goldfields Corp. is up 47% with less than two hours in today’s trading session on extremely high volume. BONZ has caught the eye of momentum traders with more continuing to pile on the buy side as the market moves toward the closing bell. Since the beginning of May the company as released an abundance of news which is driving the upward move Opening below the .01 mark today the stock has printed and intraday high of .013 on over 13 million shares traded. The three month daily average is only 67,000 shares which shows how things have quickly changed for BONZ. News announcements have been released from the company four times since May 4, which has turned today’s trading into a “Bonanza” for penny stock traders. Given the amount of news recently and trader interest, penny stock traders would do well to keep BONZ on their watclist of hot penny stocks.
Tue 3 May 2011
FCSC – Fibrocell Science
Posted by smadmin under Penny Stock Charts Of Interest
Comments Off
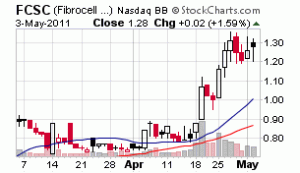
FCSC – Fibrocell Science has made exceptional gains over the past few months reaching a 52 week high last week and sustaining over a 100% gain since the beginning of the year. The question traders and investors holding positions in FCSC now must ask, “Can current price levels be maintained and new support be established?” Looking at the chart over the past few sessions, FCSC looks to be attempting do just this very thing, consolidate recent gains, keep the uptrend intact and establish a new area of support.
As can be seen by the chart below, two down days followed after the 52 week high of 1.36 was reached last Wednesday leading into the weekend. Most of this selling was more than likely the result of traders taking profits and closing their positions before heading into the weekend. This week opened Monday with buyers completing a white candle for a positive up day, however bulls did run into some selling pressure evident from the long shadow on top of Monday’s candle.
The struggle continued in today’s trading as buyers were able to win the day with a small gain of 1.59% on 808,268 shares traded. Selling pressure was forceful today but the bulls were strong shown in the long lower shadow on today’s candlestick. FCSC nevertheless will be interesting to watch in the coming days to see if a new area of support is established or a pullback is in the cards.


