web analytics

Penny Stock Charts Of Interest


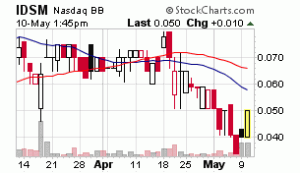
IDSM – Industrial Minerals is bouncing today after seemingly finding support after a strong downward move. The stock has moved up 25% in today’s trading on double the daily average volume going into the last hour before the closing bell. IDSM reached support in the .04 area and has rebounded nicely in what may be an attempt to reach the recent highs of Feb. and March. The 52 week high is .10 with average three month daily trading volume of 475,319 shares. No real news as been released from the company other than normal filing requirements. Today’s action is probably only a bounce play s the result of smart traders waiting for established support to be reached before taking positions after the latest pull back from the highs.
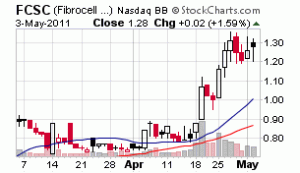
FCSC – Fibrocell Science has made exceptional gains over the past few months reaching a 52 week high last week and sustaining over a 100% gain since the beginning of the year. The question traders and investors holding positions in FCSC now must ask, “Can current price levels be maintained and new support be established?” Looking at the chart over the past few sessions, FCSC looks to be attempting do just this very thing, consolidate recent gains, keep the uptrend intact and establish a new area of support.

As can be seen by the chart below, two down days followed after the 52 week high of 1.36 was reached last Wednesday leading into the weekend. Most of this selling was more than likely the result of traders taking profits and closing their positions before heading into the weekend. This week opened Monday with buyers completing a white candle for a positive up day, however bulls did run into some selling pressure evident from the long shadow on top of Monday’s candle.

The struggle continued in today’s trading as buyers were able to win the day with a small gain of 1.59% on 808,268 shares traded. Selling pressure was forceful today but the bulls were strong shown in the long lower shadow on today’s candlestick. FCSC nevertheless will be interesting to watch in the coming days to see if a new area of support is established or a pullback is in the cards.

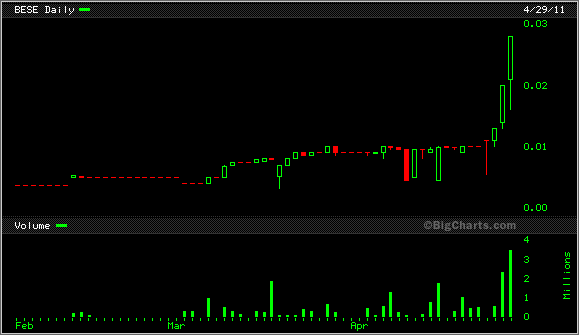
BESE – Beeston Enterprises has put together a strong three day upward move and continues to hold it’s gains into the close for the week. Opening Wednesday around .o1, BESE sustained some initial selling pressure before closing the day up marginally. Thursday’s candlestick shows traders spotted the stock on their market scans adding more buying pressure throughout yesterday’s session with very little selling pressure. Today, strong selling pressure began early as shown by the long shadow before buyers pushed the stock up, gaining momentum as the day went on printing a intraday high of .028 before bulling back slightly.


Going into the last hour of trading BESE had posted a 26% gain and a 150% gain on the week. Other than financials being released by the company on April 19, no other significant news has been released in quite some time. BESE has a 52 week high of .05 and traded sub-penny for most of the year in a sideways pattern. The three month average daily trading volume is 115,508 with over 3.4 million shares traded today. A good sign for BESE is no selling pressure going into the close as is normal before the weekend.  The stock may pullback and consolidate the gains for a few days before moving higher next week. Traders should keep BESE on their watch list for continuation of this upward move. The stock closed at the high of the day, .028, up 40%.

Next Page »